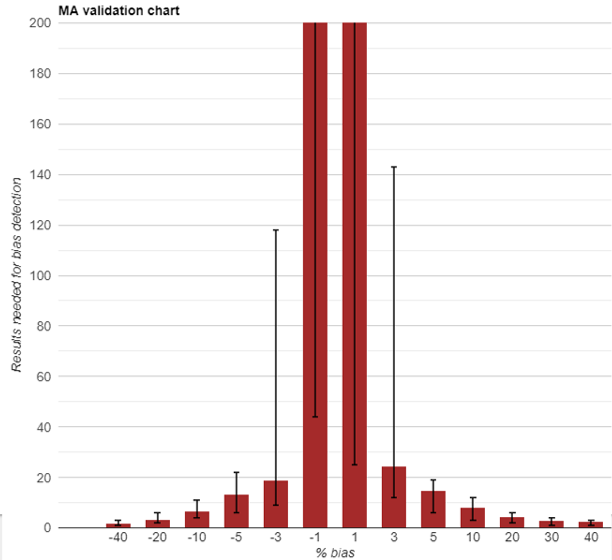
MA Generator: MA Validation chart
After selection of the optimal MA procedure, a more overall estimate of the error detection properties (validation of error-detection performance) can be obtained by MA Validation charts. In these charts the median number of patients results (bar) together with the number of patient results that were required for error detection in the 95%, 99% or all (max) simulations performed (positive error-bars). This responds to the probability of error detection and can be used as risk assessment parameter when MA QC is part of a risk-based QC plan.